Frequency Distribution of
Ungrouped and Grouped Data
Frequency distribution of ungrouped and grouped data is discussed below with examples.
Frequency distribution of ungrouped data:
Given below are marks obtained by 20 students in Math out of 25.
21, 23, 19, 17, 12, 15, 15, 17, 17, 19, 23, 23, 21, 23, 25, 25, 21, 19, 19, 19 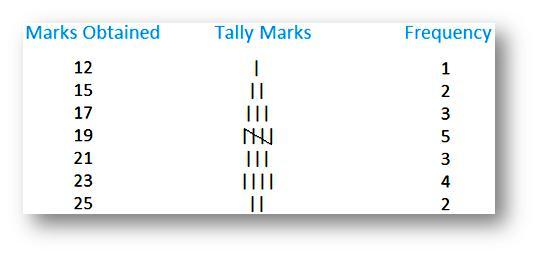
Frequency distribution of grouped data:
The presentation of the above data can be expressed into groups. These groups are called
classes or the class interval.
Each class interval is bounded by two figures called the class limits.
Marks
0 - 10
10 - 20
20 - 30
|
Number of Students
(Frequency)
0
11
9
|
Note: The
lower value of a class interval is called lower limit and upper value
of that class interval is called the upper limit. Thus, each class
interval has lower and upper limits.
For Example:
In the class interval 10 - 20, 10 is the lower limit and 20 is the upper limit.
Exclusive form of data:
This above table is expressed in the exclusive form.
In this, the class intervals are 0 - 10, 10 - 20, 20 - 30. In this, we include lower limit but exclude upper limit.
So, 10 - 20 means values from 10 and more but less than 20.
20 - 30 would mean values from 20 and more but less than 30.
Data in the inclusive form:
Marks obtained by 20 students of class VIII in Math text are given below.
23, 0, 14, 10, 15, 3, 8, 16, 18, 20, 1, 3, 20, 23, 24, 15, 24, 22, 14, 13
Let us represent this data in the inclusive form.
Marks
0 - 10
11 - 20
21 - 30
|
Number of Students
(Frequency)
6
9
5
|
Here, also we arrange the data into different groups called class intervals, i.e., 0 - 10, 11 - 20, 21 - 30.
0 to 10 means between 0 and 10 including 0 and 10.
Here, 0 is the lower limit and 10 is the upper limit. 11 to 20 means between 11 and 20 including 11 and 20.
Here, 11 is the lower limit and 20 is the upper limit.
When
the data is expressed in the inclusive form, it is converted to
exclusive form by subtracting 0.5 from lower limit and adding it to
upper limit of each class interval.
11
- 20 is expressed in the inclusive form which can be changed and taken
as 10.5 - 20.5 which is the exclusive form of the data.
Similarly, 21 - 30 can be taken as 20.5 - 30.5.
No comments:
Post a Comment