Construction of Bar Graphs
Now we will discuss about the construction of bar graphs or column graph. In brief let us recall about, what is bar graph?
Bar graph is the simplest way to represent a data.
● In consists of rectangular bars of equal width.
● The space between the two consecutive bars must be the same.
● Bars can be marked both vertically and horizontally but normally we use vertical bars.
● The height of bar represents the frequency of the corresponding observation.
For example, let us observe the following data of the bar graph.
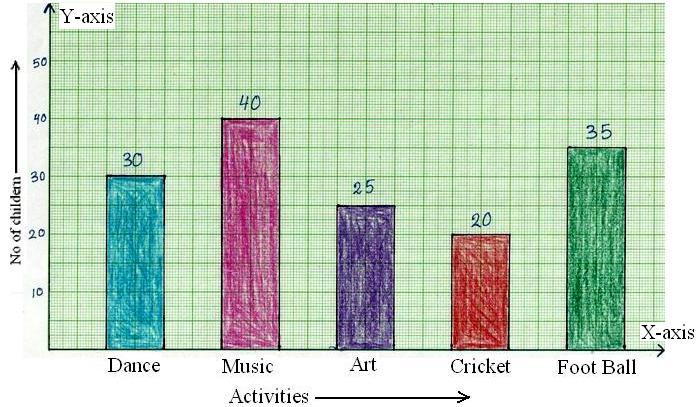
The following data gives the information of the number of children involved in different activities.
Activities
|
Dance
|
Music
|
Art
|
Cricket
|
Football
|
No. of Children
|
30
|
40
|
25
|
20
|
53
|
How to Construct a Bar Graph?
Steps in construction of bar graphs/column graph:
● On a graph, draw two lines perpendicular to each other, intersecting at 0.
● The horizontal line is x-axis and vertical line is y-axis.
●
Along the horizontal axis, choose the uniform width of bars and uniform
gap between the bars and write the names of the data items whose values
are to be marked.
●
Along the vertical axis, choose a suitable scale in order to determine
the heights of the bars for the given values. (Frequency is taken along
y-axis).
● Calculate the heights of the bars according to the scale chosen and draw the bars.
Bar graph gives the information of the number of children involved in different activities.
Solved examples on construction of bar graphs:
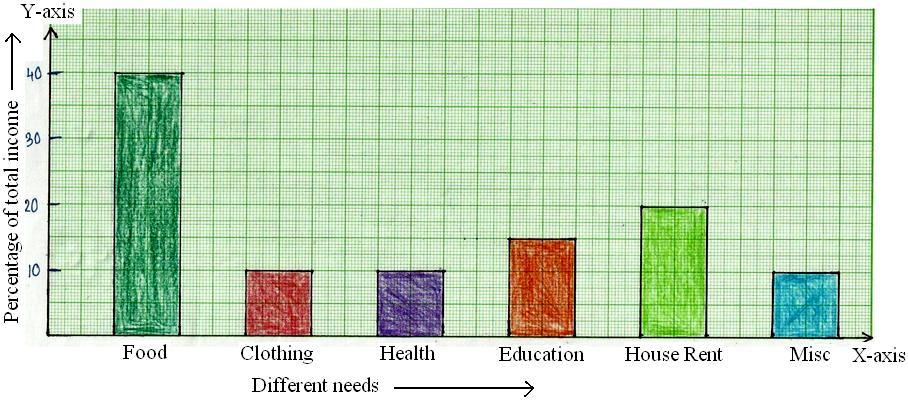
1. The percentage of total income spent under various heads by a family is given below.
Different Heads
|
Food
|
Clothing
|
Health
|
Education
|
House Rent
|
Miscellaneous
|
% Age of Total
Number |
40%
|
10%
|
10%
|
15%
|
20%
|
5%
|
Represent the above data in the form of bar graph.
2. 150 students of class VI have popular school subjects as given below:
Subject
|
French
|
English
|
Maths
|
Geography
|
Science
|
Number of Students
|
30
|
20
|
26
|
38
|
34
|
Draw the column graph/bar graph representing the above data.
Solution:
Take the subjects along x-axis, and the number of students along y-axis
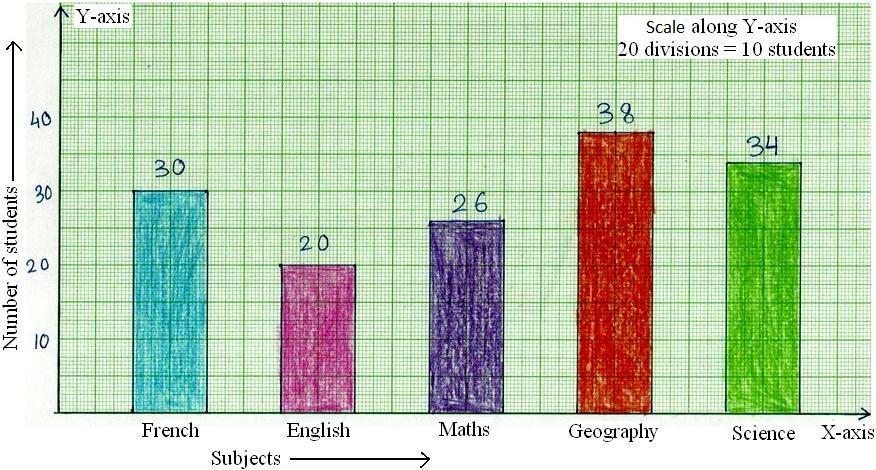
Bar graph gives the information of favourite subjects of 150 students.
3. The
vehicular traffic at a busy road crossing in a particular place was
recorded on a particular day from 6am to 2 pm and the data was rounded
off to the nearest tens.
Time in Hours
|
6 - 7
|
7 - 8
|
8 - 9
|
9 - 10
|
10 - 11
|
11 - 12
|
12 - 1
|
1 - 2
|
Number of Vehicles
|
100
|
450
|
1250
|
1050
|
750
|
600
|
550
|
200
|
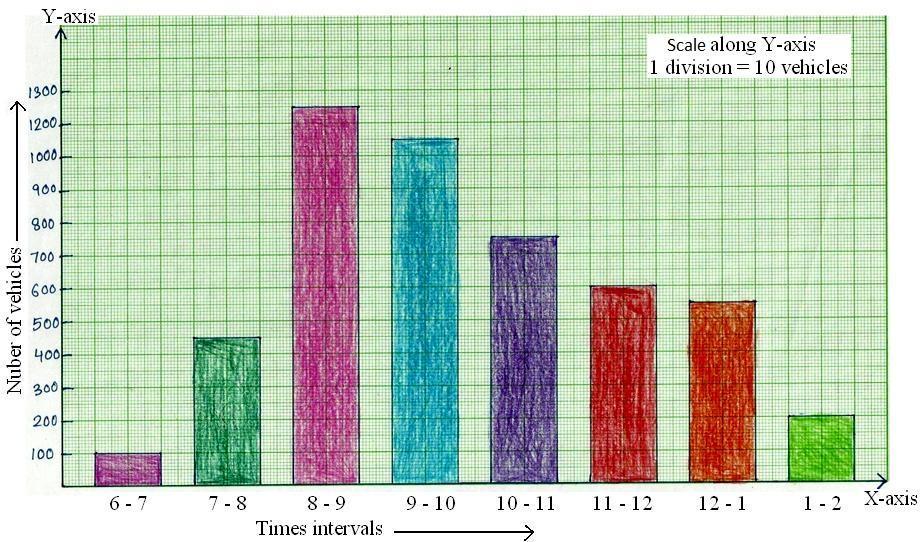
Bar graph gives the information of number of vehicles passing through the crossing during different intervals of time.
No comments:
Post a Comment